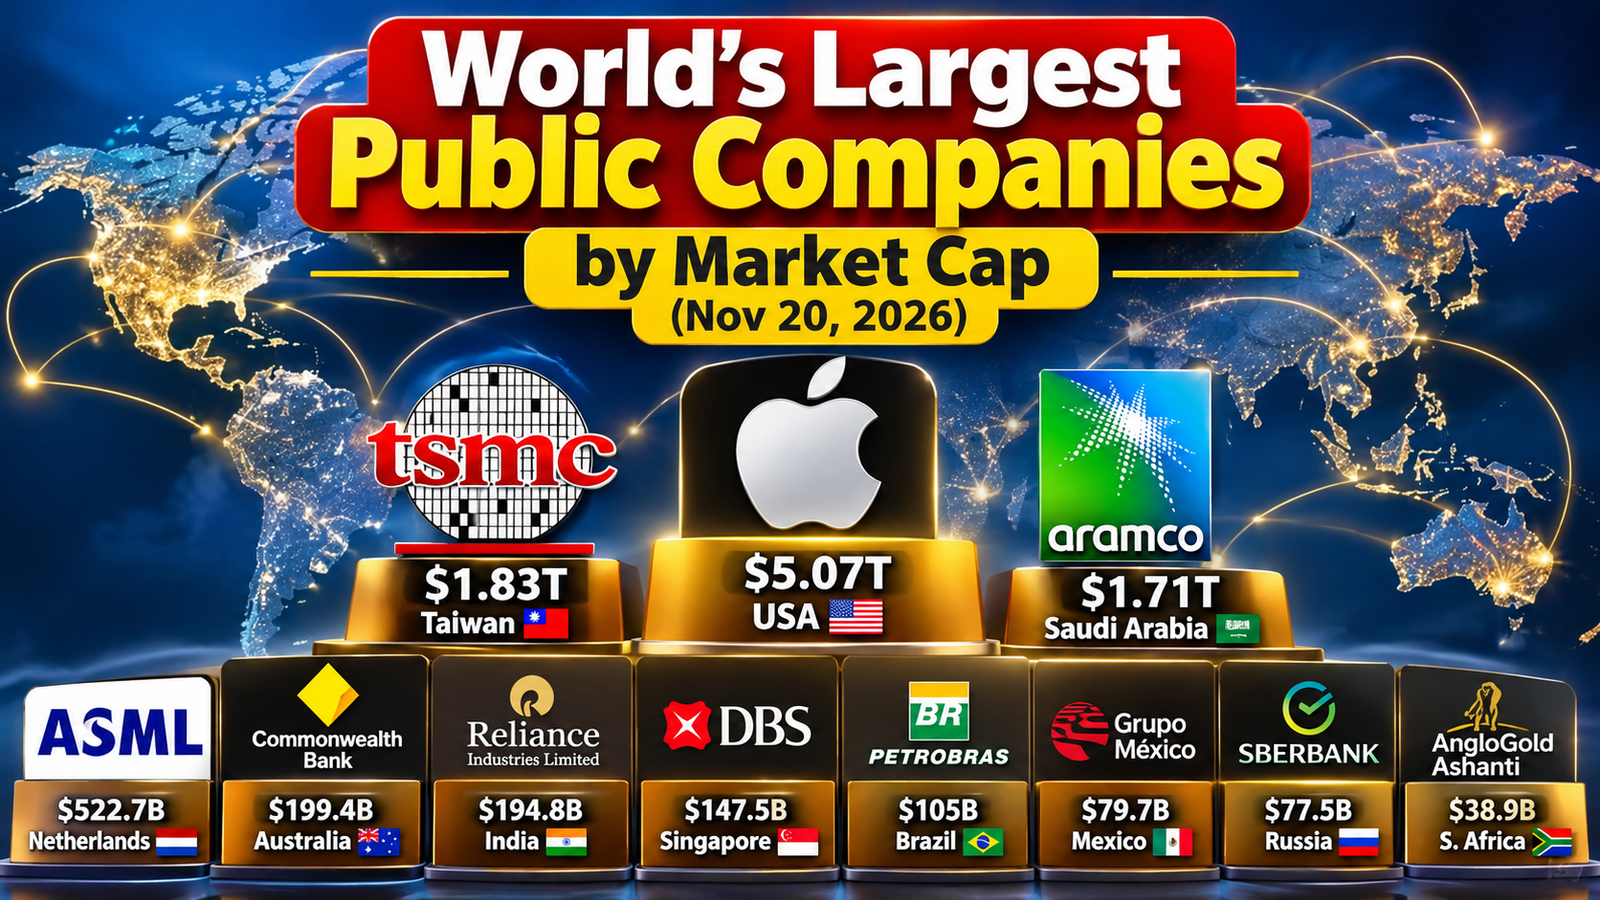
Apple (United States) — $5.07 T — Consumer Electronics, Technology
TSMC (Taiwan) — $1.83 T — Semiconductors
Saudi Aramco (Saudi Arabia) — $1.71 T — Oil & Gas
ASML (Netherlands) — $522.7 B — Semiconductor Equipment
Commonwealth Bank (Australia) — $199.4 B — Banking, Financial Services
Reliance Ind. (India) — $194.8 B — Energy, Retail, Telecommunications
DBS Group (Singapore) — $147.5 B — Banking, Financial Services
Petrobras (Brazil) — $105.0 B — Oil & Gas
Grupo México (Mexico) — $79.7 B — Mining, Infrastructure
Sberbank (Russia) — $77.5 B — Banking, Financial Services
AngloGold Ashanti (South Africa) — $38.9 B — Gold Mining
(November 20, 2026)
What is Market capitalization (M Cap)
Market capitalization (commonly called market cap) is the total market value of a publicly traded company’s outstanding shares of stock. It serves as a quick, standardized way to measure a company’s overall size and worth in the stock market, rather than relying solely on its stock price.
How It Is Calculated
The formula for market cap is straightforward:
$$\text{Market Cap} = \text{Current Share Price} \times \text{Total Outstanding Shares}$$
For example, if a company has 10 million shares available on the open market and each share trades at $50, its market cap is $500 million.
Why Share Price Alone Can Be Misleading
A higher stock price does not automatically mean a company is larger. If Company A trades at $100 per share with 1 million shares, its market cap is $100 million. If Company B trades at $20 per share with 50 million shares, its market cap is $1 billion—making Company B ten times more valuable despite its lower share price.
Real-World Examples
Looking at the regional market leaders from the infographic:
- Mega-Cap Giants: Apple holds a massive market cap of $5.07 trillion, while TSMC sits at $1.83 trillion and Saudi Aramco at $1.71 trillion.
- Large-Cap Leaders: Regional powerhouses like ASML ($522.7 billion), Reliance Industries ($194.8 billion), and Petrobras ($105.0 billion) represent huge, established businesses that anchor their respective national economies.
Market Cap Categories
Investors typically group companies by market cap to gauge risk and growth potential:
- Large-Cap ($10B+): Established, stable industry leaders with lower volatility.
- Mid-Cap ($2B – $10B): Growing companies balancing stability with expansion potential.
- Small-Cap ($250M – $2B): Younger or niche businesses offering higher growth potential alongside higher risk.