
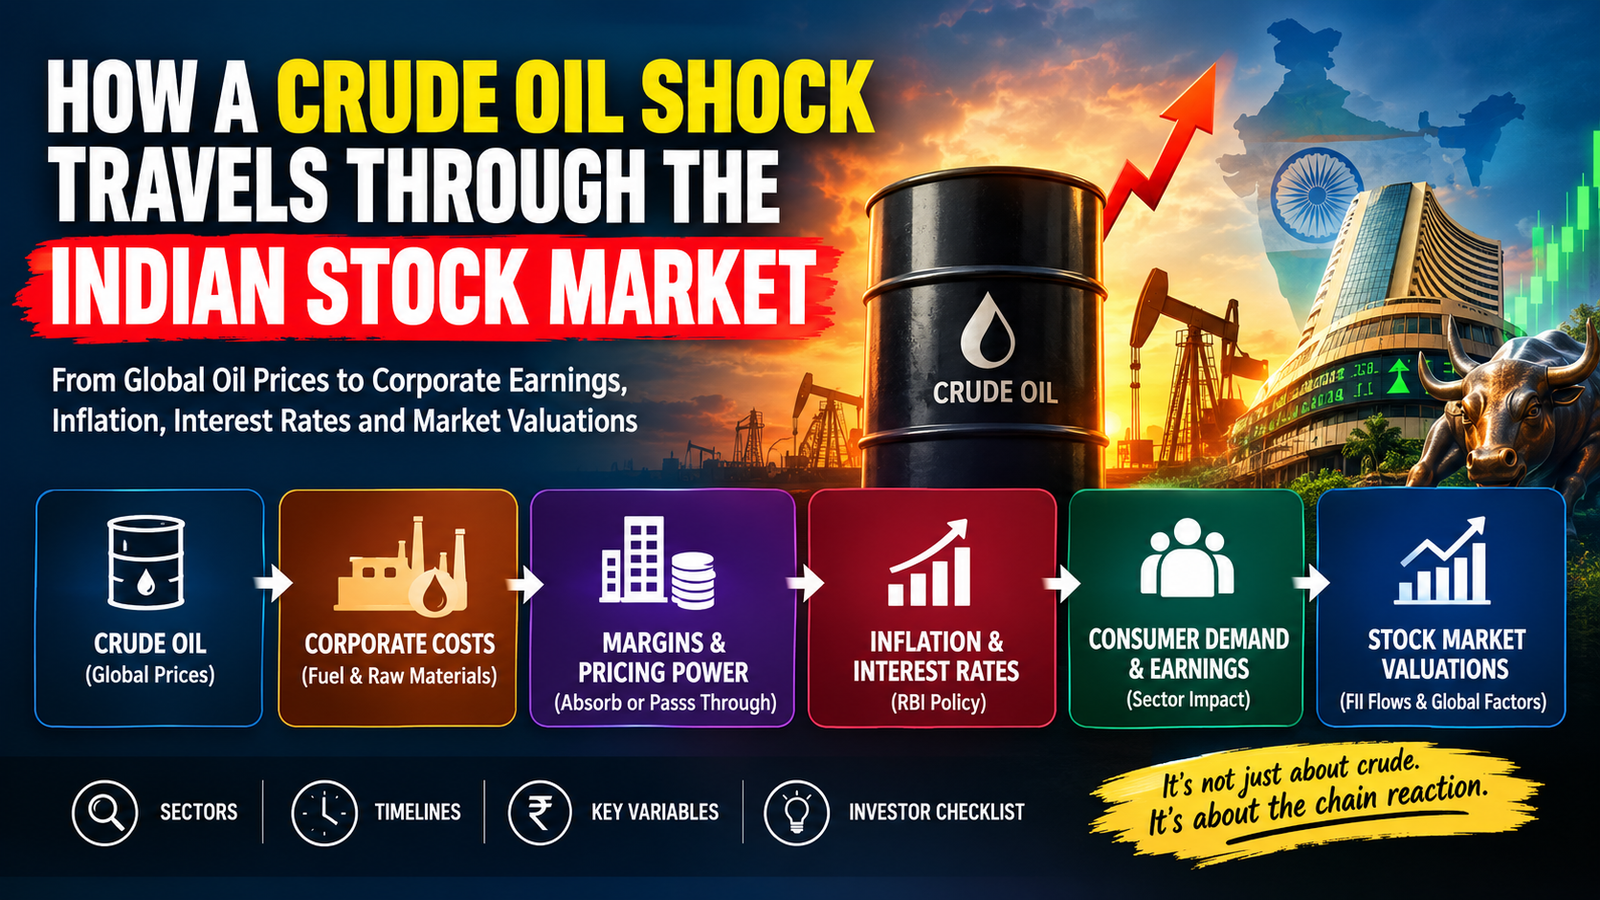
When crude oil prices rise sharply, the obvious reaction is to ask:
“Which stocks will fall?”
That is the wrong starting point.
The more useful question is:
How does a crude oil shock travel from the commodity market into corporate costs, margins, inflation, interest rates, demand and ultimately stock valuations?
The answer is not immediate, and it is not uniform.
For some companies, the impact can appear almost instantly in operating costs. For others, it may take several months to show up in quarterly earnings. And for a third group, the effect may arrive indirectly through inflation, interest rates and weaker consumer demand.
This creates a three-wave transmission mechanism through which global crude oil prices can influence Indian corporate earnings and the broader equity market.
The Oil Bill Mechanism
A common mistake investors make is assuming that a rise in global crude prices immediately appears in every company’s profit and loss statement.
It doesn’t.
Companies operate with inventories, procurement contracts, transportation arrangements and pricing cycles. Depending on the business, these factors can create a lag of weeks or even a few months between the initial crude-price movement and its full impact on earnings.
The broad transmission mechanism looks like this:
Crude Oil ↑ → Fuel/Input Costs ↑ → Margin Pressure → Price Pass-Through → Inflation → Interest Rates → Demand → Earnings → Valuations
The crucial point is that every company enters this chain at a different stage.
That is why crude exposure should never be treated as a simple sector-level classification.
Wave 1: The Immediate Impact — Direct Fuel Costs
The first wave hits companies where fuel is a significant and recurring operating expense.
Think of businesses where fuel is not a peripheral cost, but part of the daily economics of running the business.
Major exposed sectors include:
- Airlines
- Oil Marketing Companies
- Logistics
- Road Transportation
For an airline, for example, aviation turbine fuel is a major operating expense.
For a logistics or transportation company, diesel directly affects the cost of moving goods.
The transmission is therefore relatively straightforward:
Crude Oil ↑
↓
Fuel Prices ↑
↓
Operating Costs ↑
↓
Margins ↓
The speed of this impact depends on how quickly fuel prices adjust and whether the company has the ability to pass higher costs to customers.
This makes pricing power one of the most important variables to watch.
A company that can increase prices without materially affecting volumes may protect its margins.
A company operating in a highly competitive market may have to absorb much of the increase.
The same crude shock can therefore produce very different earnings outcomes for two companies operating in the same broad industry.
Wave 2: The Short-Term Impact — Input Costs
The second wave is less obvious.
Many businesses are not large consumers of crude itself. Instead, they use products whose prices are linked to crude.
This creates a second-order impact.
Sectors that can experience this transmission include:
- Chemicals
- Plastics
- Textiles
- Building Materials
- Tyres
- Telecom
- Hospitality
The chain now becomes:
Crude Oil ↑
↓
Petrochemical & Oil-Derivative Prices ↑
↓
Raw-Material Costs ↑
↓
Gross Margin Pressure ↑
↓
Quarterly Earnings Impact
This is why investors sometimes see a crude-price rally without an immediate reaction in the earnings of these companies.
The impact may take time to work through inventory and procurement cycles.
A business may still be selling products manufactured using relatively cheaper inventory while simultaneously purchasing new inventory at higher prices.
Eventually, however, the higher input cost can enter the income statement.
This is where quarterly results become particularly important.
Investors should look beyond revenue growth and examine:
- Gross margins
- EBITDA margins
- Raw-material costs
- Inventory effects
- Pricing actions
- Volume growth
The critical question is:
Is the company passing higher input costs to customers, or is it absorbing them?
Wave 3: The Medium-Term Impact — Inflation, Interest Rates and Demand
The third wave is where a crude shock becomes a macroeconomic event.
Suppose companies across the economy face sustained increases in fuel and raw-material costs.
They have two broad choices.
Absorb the increase
Costs ↑ → Margins ↓
Or:
Pass the increase to customers
Costs ↑ → Selling Prices ↑
If enough companies choose the second option, inflationary pressure can spread through the economy.
The transmission becomes:
Crude Oil ↑
↓
Transportation & Production Costs ↑
↓
Consumer Prices ↑
↓
Inflation ↑
↓
Monetary Policy Pressure ↑
↓
Interest Rates ↑
↓
Borrowing Costs ↑
↓
Consumption & Investment Pressure
This is where companies with little or no direct oil exposure can eventually feel the impact.
The Hidden Oil Exposure of Banks, NBFCs and Real Estate
Consider a bank.
A bank does not need crude oil to generate revenue.
Yet a persistent oil shock can still matter.
If inflation rises and monetary conditions tighten, funding costs and borrowing costs can change.
Credit demand may also respond to higher interest rates.
Similarly, real estate can be affected through the financing channel.
Higher borrowing costs can increase the cost of mortgages and project financing, potentially putting pressure on affordability and investment demand.
So the crude-to-stock-market relationship is not simply:
Oil → Oil Companies
It can become:
Oil → Inflation → Interest Rates → Financial Conditions → Banks/NBFCs/Real Estate
This is why the third wave is potentially much broader than the first two.
What Happens to FMCG and Automobiles?
Consumer-facing sectors experience another important transmission mechanism: disposable income.
When fuel, transportation and essential goods become more expensive, households may have less money available for discretionary spending.
That can affect:
- FMCG consumption
- Automobile purchases
- Consumer durables
- Travel
- Other discretionary spending
The mechanism is:
Inflation ↑ → Real Disposable Income Pressure ↑ → Consumption Growth ↓ → Volumes ↓
This is fundamentally different from the first-wave impact.
An airline may suffer because fuel directly increases its costs.
An automobile company may suffer later because consumers become more cautious about spending.
That distinction matters.
Why Pricing Power Matters More Than Crude Exposure Alone
Here is the simplest way to understand the problem.
Imagine two companies facing a 15% increase in input costs.
Company A
Input costs: +15%
Selling prices: +15%
The company successfully passes through the increase.
Margins may remain relatively protected.
Company B
Input costs: +15%
Selling prices: +5%
The company absorbs most of the shock.
Margins come under pressure.
Both companies face the same commodity environment.
Their earnings outcomes can be completely different.
Therefore, when analysing crude-sensitive businesses, investors should ask:
Does the company have pricing power?
But even pricing power has a limit.
If price increases become too aggressive, customers may reduce consumption or switch to competitors.
That introduces the next variable:
Price Pass-Through vs. Volume Loss
A successful cost pass-through is not necessarily positive if it destroys demand.
The Global Capital Flow Connection
Crude oil is also relevant because India is a major importer of energy.
A sustained increase in crude prices can affect the country’s external balance and inflation dynamics.
At the same time, Indian equities compete for global capital with other markets.
When US Treasury yields are elevated, global investors may reassess the relative attractiveness of emerging-market assets versus US fixed-income securities.
For example, a US 10-year Treasury yield around 5.25% represents a very different global opportunity set from an environment where US yields are substantially lower.
This does not mean that every episode of FII selling is caused by crude oil.
Foreign portfolio flows respond to a combination of:
- US interest rates
- Dollar strength
- Global risk appetite
- Emerging-market valuations
- Domestic earnings expectations
- Geopolitical developments
- Relative market opportunities
Crude is one variable within that broader framework.
Why India Is Not the Same Economy It Was During Earlier Oil Shocks
One important point often gets lost in headline-driven market commentary:
India’s vulnerability to crude prices is not static.
The country has diversified its sources of crude imports, reducing dependence on individual supply regions.
There is also an important macro distinction.
The oil-import burden relative to the size of India’s economy is lower than during some earlier periods of extreme oil sensitivity.
In simple terms:
The same percentage increase in crude prices does not necessarily produce the same macroeconomic shock that it would have produced in an earlier period.
That does not eliminate India’s vulnerability.
It simply means the relationship between crude and the Indian economy needs to be analysed in the context of the country’s current economic structure.
The RBI Becomes an Important Variable
Once crude begins influencing inflation, investors need to watch monetary policy.
The key question is not merely:
“Is crude rising?”
It is:
Is the crude shock persistent enough to influence the inflation outlook and monetary-policy response?
If inflation remains elevated, interest-rate expectations can change.
That matters particularly for rate-sensitive sectors.
Watch:
- RBI communication
- Inflation projections
- Bond yields
- Liquidity conditions
- Lending rates
- Credit growth
- Deposit costs
The crude market therefore has the potential to influence equities through a second financial-market channel:
Crude → Inflation Expectations → Bond Yields → Equity Valuations
The Mean-Reversion Opportunity
Not every oil shock creates permanent damage.
This distinction is critical.
Suppose crude rises sharply for a period and companies temporarily absorb the increase.
Margins deteriorate.
Then crude stabilises or falls.
Input costs begin normalising.
The same company may then experience:
Input Costs ↓
↓
Margins Recover
↓
Operating Leverage Improves
↓
Earnings Recover
This is the concept of margin mean reversion.
But investors must distinguish between temporary margin compression and structural deterioration.
Temporary shock
Costs rise → margins fall → costs normalise → margins recover.
Structural problem
Costs rise → competitive position weakens → demand changes → pricing power deteriorates → earnings remain impaired.
The difference is crucial.
A business with temporarily depressed margins may look very different from a business whose economics have permanently changed.
The Investor’s Crude-Oil Dashboard
Instead of watching crude prices in isolation, investors can monitor a broader set of indicators.
| Variable | What It Tells You |
|---|---|
| Crude Price | Size and direction of the initial shock |
| Fuel Prices | Direct operating-cost transmission |
| Petrochemical Prices | Second-order input-cost pressure |
| Gross Margins | Extent of cost absorption |
| Price Hikes | Pricing power |
| Volumes | Demand response to higher prices |
| RBI Policy | Inflation and monetary-policy response |
| Bond Yields | Financial-condition pressure |
| USD/INR | Imported inflation dynamics |
| FII Flows | Global allocation and risk appetite |
| Inventory Levels | Potential earnings transmission lag |
This dashboard is far more useful than simply tracking whether Brent crude is up or down.
The Complete Mental Model
The entire crude-oil transmission mechanism can be reduced to five layers.
Layer 1 — Commodity Shock
Crude Oil ↑
↓
Layer 2 — Corporate Costs
Fuel + Raw Materials ↑
↓
Layer 3 — Corporate Response
Absorb Costs vs. Pass Through
↓
Layer 4 — Macro Economy
Inflation ↑ → Rates ↑ → Demand Pressure
↓
Layer 5 — Equity Market
Earnings Expectations + Interest Rates + Risk Premium → Valuations
This is the framework investors should carry into every crude-price shock.
Five Questions to Ask Before Making an Investment Call
When crude prices start moving sharply, don’t immediately ask which stocks will fall.
Ask these five questions instead:
1. How directly is the company exposed to crude?
Is crude a direct operating expense, an input cost, or merely a macro variable?
2. How quickly will the shock reach earnings?
Look at inventory cycles, procurement contracts and pricing mechanisms.
3. Can the company pass the cost to customers?
Pricing power determines how much of the shock reaches margins.
4. Will price increases damage volumes?
A company may protect margins but sacrifice demand.
5. What happens if the oil shock persists?
This determines whether the problem remains a temporary cost shock or develops into a broader inflation-and-interest-rate cycle.
Final Takeaway
The simplistic market narrative is:
“Oil rises, Indian stocks fall.”
Reality is considerably more complicated.
A crude shock travels through the economy in stages.
First, it hits businesses with direct fuel exposure.
Second, it moves through oil-linked raw materials and production costs.
Third, if the shock persists, it can influence inflation, interest rates, borrowing costs and consumer demand.
The final impact on a company therefore depends on a combination of:
Crude Exposure + Transmission Lag + Pricing Power + Volume Sensitivity + Interest Rates + Demand
That is the real “Oil Bill” mechanism.
For investors, the objective should not be to predict the crude price from a single headline.
It should be to understand where the shock enters the economic system, how quickly it travels, who absorbs the cost, and whether the resulting earnings pressure is temporary or structural.
Once you start viewing crude through that lens, the relationship between oil prices, corporate earnings and the Indian stock market becomes far easier to analyse.